Debugging JavaScript: various breakpoints
Most of the developers know that you can stop the execution of a script by either placing debugger; in the code or clicking on a specific line in a browser’s debug tool. That’s just a tip of the debugging iceberg.
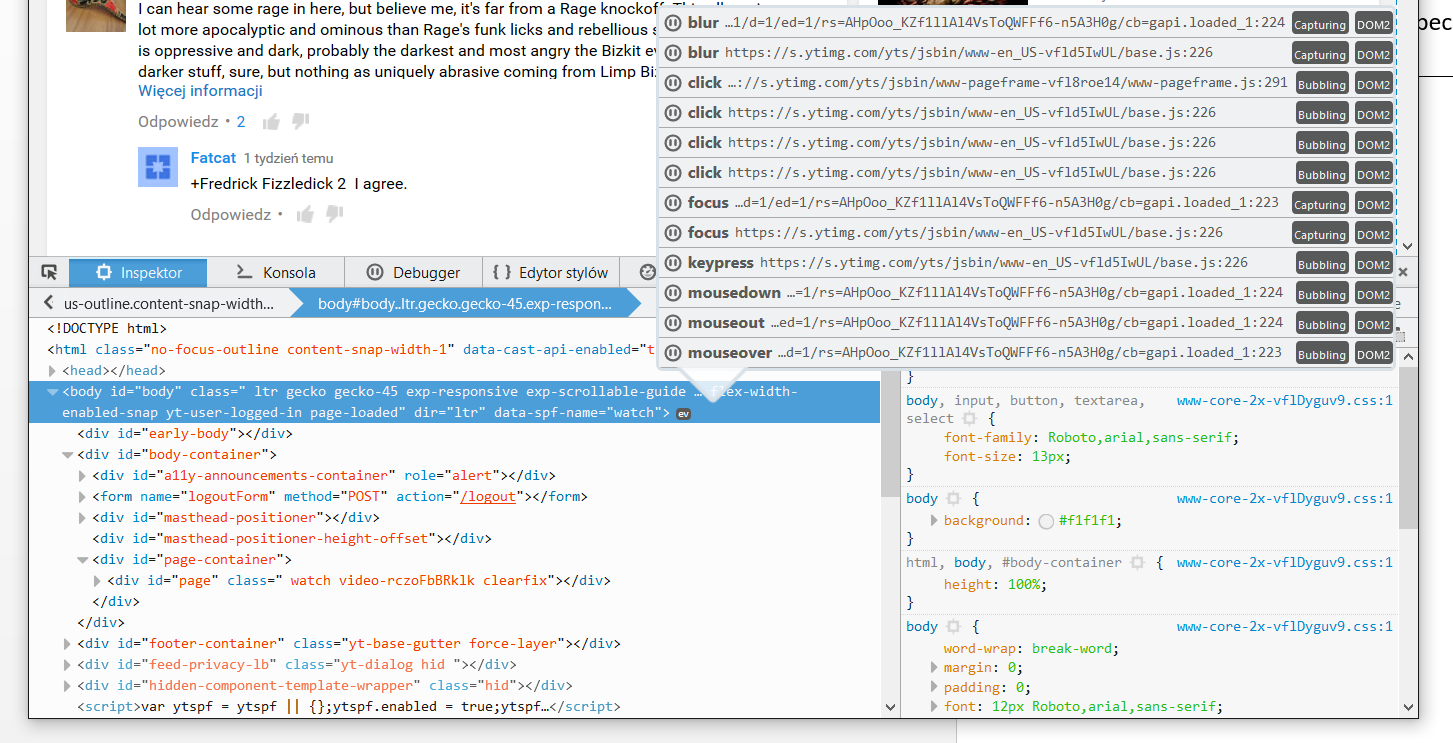
When you look at the HTML in the inspector tool in the Firefox you’ll see the “ev” labels next to some of the elements. It’s an indication of bound events. If you click on it you’ll see the whole list of them. You can pick one, click on it and then put a breakpoint in it.

Installing Firebug gives you even more options. After you open the Firebug’s preview of the HTML you can right click on an element and then choose one of the following debug options:
- Break on attribute change
- Break on child addition or removal
- Break on element removal
Just imagine you are presented with a website which uses lots of different JS plugins. One of them doesn’t work like in its demo from the official page. E.g. it might be a modal window closing immediately after it’s opened. Probably some other plugin is messing with it, but which one? Sure, you can disable them one by one and finally you’ll find the offender. It’s simply much easier to check what changes the modal’s attributes (e.g. its style attribute is being set to display: none).
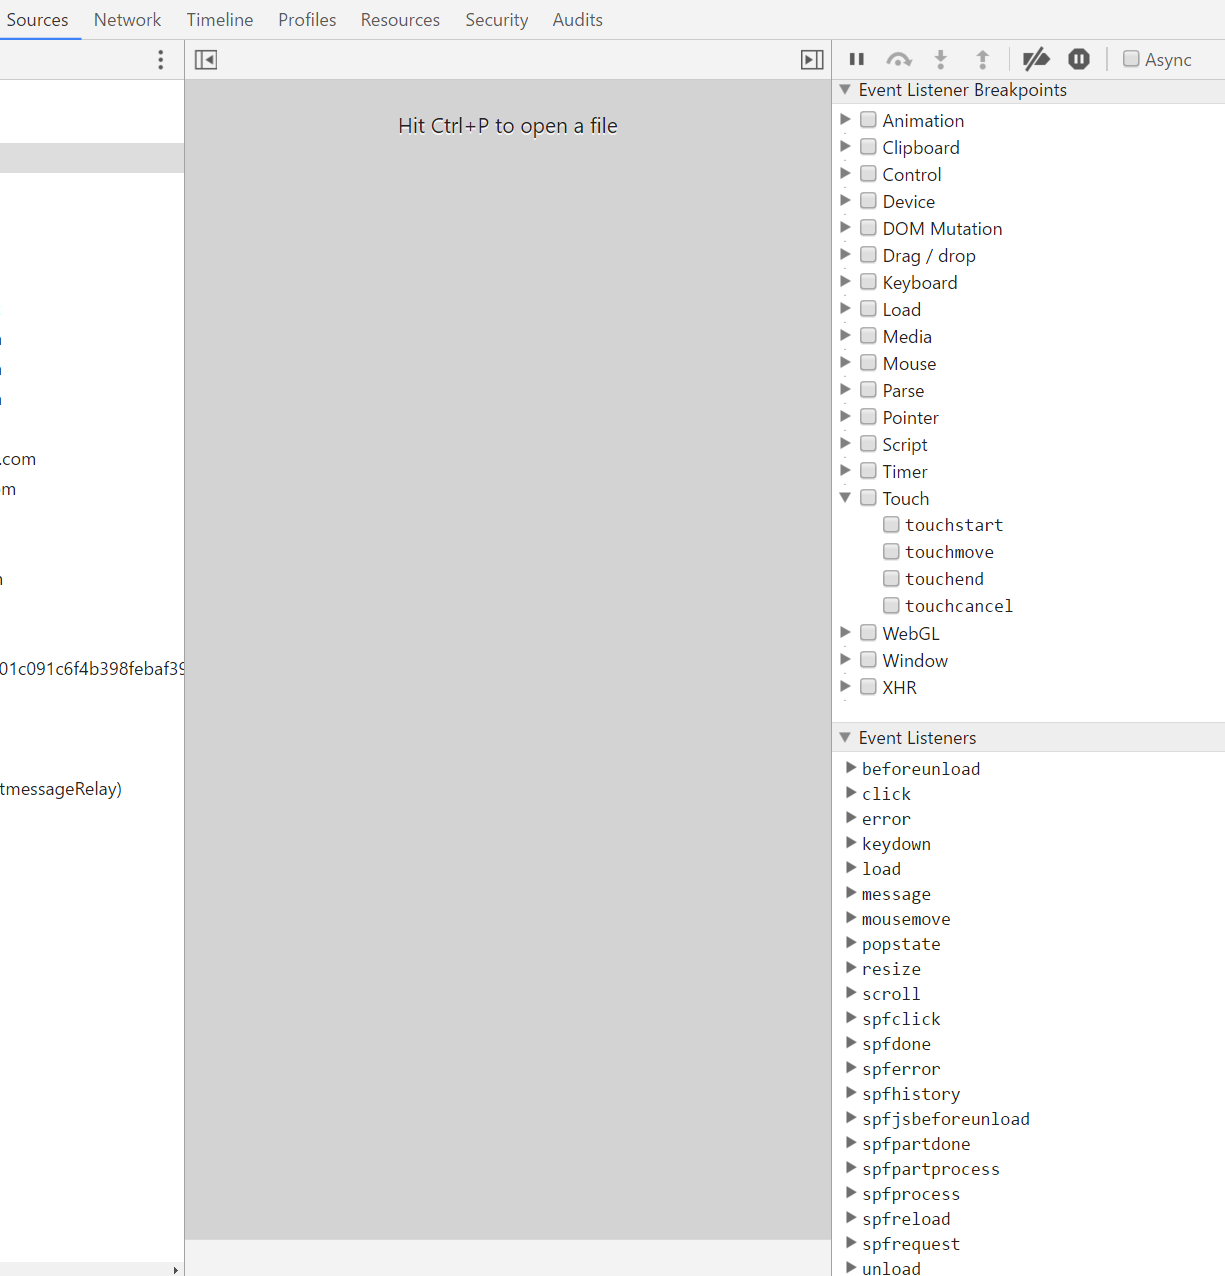
Even though I strongly favour the Firefox over the Chrome for a number of reasons I have to admit that Chrome offers the most when it comes to setting breakpoints while debugging. Just look at this list.

It can really save you days, especially when you’re dropped into a new, big project. I focused on the touch events on my screenshot, but under the “control” there are also very important events related to the focus. Speaking of the touch events let’s not forget that you can simulate them in the mobile mode.
Another nice option is the ability to remove event listeners. It makes the debugging simpler when you can get rid of the “safe” parts and only dig into the unknown.
I want to stress that “unknown” bit. If you know where to place debugger; manually then you’re almost there and a console log would suffice. All of these breakpoints truly shine when you’re trying to find some interference introduced by other developers or an external software. You know, those evil ones who always find it a good idea to solve their problems by doing something globally ;).